
Loyola outdoes national graduation rates but sees room to improve
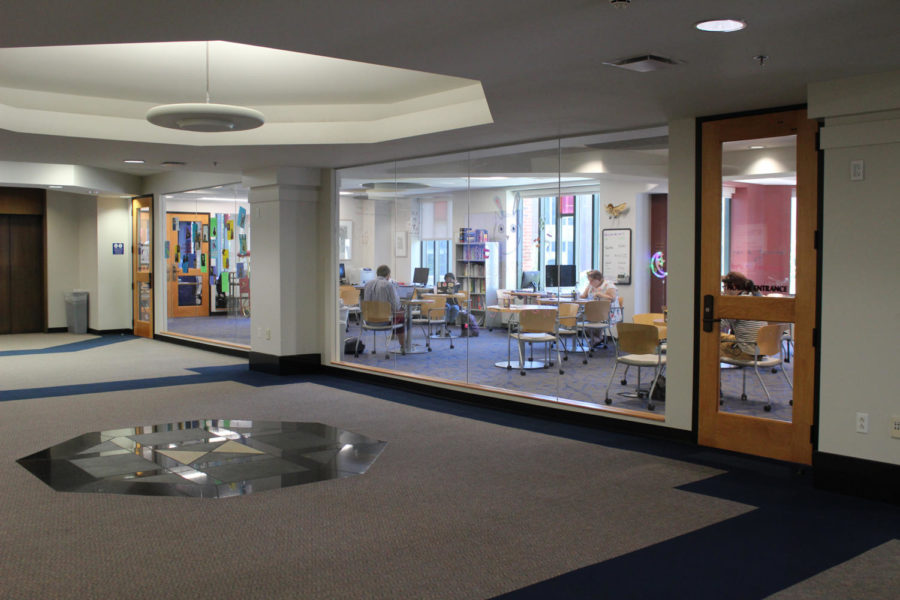
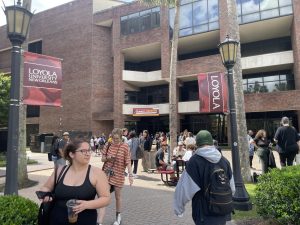
Students are studying in the Student Success Center. Resources like the Center contribute to high graduation rates. Photo credit: Cristian Orellana
April 2, 2019
When freshmen step onto campus, they dream of walking across the stage to grab a diploma. At Loyola, they have generally been doing that more than their peers across the nation.
Loyola’s graduation rates have been above average or on par with national six-year completion rates for the last seven years.
However, there is still work to be done when comparing Loyola’s graduation rates with it’s peer group. In general, students graduate at a higher rate when you just look at four-year, private, non-profit universities, and Loyola administrators say they are committed to bridging that gap.
The most recent data for both national graduation rates and Loyola graduation rates points toward common trends found in the past seven cohorts of college students, beginning with the cohort of students who began college in 2006 – the fall after Hurricane Katrina.
The six-year national graduation rate for all colleges for the cohort of 2012 was 58 percent, according to a study done by the National Clearinghouse Research Center, while Loyola’s cohort of 2012 graduated at a rate of 61 percent, according to the Loyola Fact Book – five percentage points higher. But, the total completion rate for students who studied at private four-year universities and started the same year, was 76 percent – 15 percentage points higher than Loyola’s rate.
The same pattern follows for previous years. The national rate for the cohort of 2011 was 56 percent. Loyola’s rate for the same year – also 56 percent. The private four-year rate was 20 percentage points higher than both at 76 percent. Loyola’s highest graduation rate since the cohort of 2005, came for the students who began school in 2009. Sixty-six percent of students graduated within six years, while the national average was only 52 percent. The private four-year rate still outdid Loyola by three percentage points – at 69 percent.
Faye Huie, a research associate at the National Student Clearinghouse who works on the annual completing college report, emphasized the importance of tracking graduation rates to set national benchmarks for institutions to compare and evaluate themselves against.
“The educational community has always been, and always will be, interested in outcomes. One of the major goals of post-secondary institutions is to ensure that their students graduate with a degree,” Huie said.
And according to Elizabeth Rainey, director of student success, Loyola is always working to improve graduation rates.
Loyola’s Graduation Services
“First of all, graduating students is everyone’s job,” said Rainey.
And in the past few years, that message has been emphasized across all departments, culminating in a variety of new and revamped services to help students transition first from high school to college, and then from college to careers.
Loyola’s new Pan-American Student Success Center opened last June, housing five points of service located in one centralized space to help students succeed and attain a degree. Students can find advising and tutoring services, study places, and educational workshops within the center, located on the second floor of the Monroe Library.
One of the newest offerings is a first-year advising team as well as a success coaching team. Both place a focus on first-year students but work with other students by request.
“I would point to advising being a critical component to graduation rates, because getting the right advice about the courses you have or the options you have from the moment you enroll is critical to an on-time graduation,” Rainey said.
When it comes time for advising, many students are left in the dark while advisors are still working off handwritten degree program course listings. So, academic affairs is launching a new advising program called Planner, which will allow students to map out their courses electronically and will secure that information in one easily located place.
“It shows you the hypothetical and it’s really getting technology aligned with our systems so students can understand what they need to take and have more autonomy and a role in their planning,” Rainey said.
While Rainey doesn’t think the previous methodology of academic advising is necessarily responsible for graduation rates, it can be a factor for students who come in undeclared and unsure of what they want to study.
Another way the Student Success Center is aiming to improve graduation rates is by providing career development services. For students who are uncertain of which major to pursue, career services allow them to explore majors and internships, and shadow other students.
“When students bounce around different majors, sometimes that can delay graduation unless you are very thoughtful and strategic,” Rainey said.
Rainey said that while there is no collective focus or committee primarily working on graduation rates under Project Magis, the strategic planning process aiming to financially stabilize the university, it’s more of an infused process.
“I think it should be direct. I do think we should be talking about retention along with graduation,” Rainey said. “But sometimes the data look different.”
Retention
And while Project Magis hasn’t specifically set its sights on improving graduation rates, one thing the administration has been emphasizing is improving retention rates from freshman to sophomore year.
“We always imagine that retention is just the start. Talking about who comes back is just the beginning of having a larger conversation. I don’t just care about someone coming back. I care that they graduate,” Rainey said.
And according to Huie, Rainey isn’t wrong to possibly think that there is a correlation between the two.
“When graduation rates go up, retention rates also go up. Institutions generally want to retain their students so that they eventually graduate,” Huie said. “However, this ultimately depends on the goals of the students. Not all students who enroll in college may want to earn a degree.
In the last seven years, the cohorts with the three lowest retention rates between first year to second year also had the three lowest six-year graduation rates. The cohort of 2007 had only a 73 percent retention rate and a graduation rate of 55 percent. The cohort of 2010 retained 77 percent of students and graduated 55 percent while the cohort of 2011 went 74 percent for retention and 56 percent for graduation.
Conversely, the cohort of 2009, the group with the highest graduation rate in the last seven years, at 66 percent, also had the highest retention rate at 82 percent.
At a Project Magis meeting in fall of 2017, Cissy Petty, former vice president for student affairs and associate provost said retention rates had been set for the following three years – at 82 percent in 2018, 84 percent in 2019 and 88 percent in 2020. The cohort of 2017, surpassed the original goal with a retention rate of 85 percent, according to the Common Data Set.
Acceptance Rates
Another area in which universities can compare their graduation rates is with universities that have similar acceptance rates. Typically, universities with the lowest acceptance rates have the highest graduation rates, and conversely, those with open admissions tend to have the lowest graduation rates, according to the National Center for Education Statistics.
For the seven most recent years of data, Loyola acceptance rates have fallen in the 50 to 74 percent acceptance rate category, hovering around an average of 60 percent acceptance. Only once in those seven years, was Loyola’s graduation rate higher than the average graduation rate for all universities with acceptance rates between 50 to 74 percent – the cohort of 2009, the highest graduating cohort at 66 percent versus the national average of 62 percent.
The cohort of 2007’s graduation rate was nine percentage points behind the national average for universities with similar acceptance rates – 55 percent versus 64 percent.
But while Loyola struggled to keep up with universities in the 50 to 74 percent acceptance rate range, the university no longer falls under that category. As the university aims to significantly improve class sizes to help with budgetary problems, Loyola has jumped two categories, to universities with acceptance rates of 90 percent or more. The acceptance rate in 2017 was 69 percent. In 2018? Almost 95 percent, according to the Common Data Set.
“Certainly, there is concern that if students enroll who don’t have the right academic background or don’t have the financial plans to be here or the interest or commitment to be here, that can impact your graduation rates,” Rainey said. “It’s a fine balance. We do want to create access and openness in our education, but do so, so that these students will go on to graduate.”
Rainey also emphasized Loyola’s commitment to providing a learning space for students from different backgrounds.
“You can look at numbers. You can look at some schools and they don’t have nearly as many students who come from backgrounds of financial need,” Rainey said. “More than 30 percent of our students qualify for Pell Grants. Lots of our peer institutions, that number is below eight.”
The implications of Loyola’s higher acceptance rate on graduation rates won’t be known for another six years but despite how acceptance and graduation rates continue to fluctuate, Rainey takes pride in Loyola’s community.
“We educate students, and want them to graduate with a degree they’re proud of,” Rainey said.